Random Walk#
Example from Feynman Chapter 6 Vol. 1
import numpy as np
import matplotlib.pyplot as plt
%matplotlib inline
# number of walks
n = 1000

# number of steps
s = 100

# distance from starting point
d = []

for i in range(0,n):
    w = []
    x = np.random.uniform(-1,1,s)
    for i in range(0,np.size(x)):
        if x[i]>0:
            w.append(1)
        else:
            w.append(-1)
    d.append(np.sum(w))
# print d
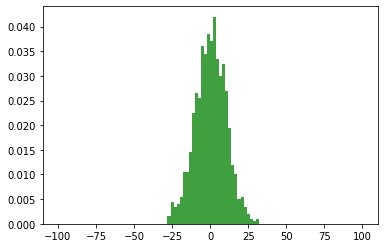
# the histogram of the data
n, bins, patches = plt.hist(d, 100, range=[-100,100], density=True, facecolor='green', alpha=0.75)
plt.show();


