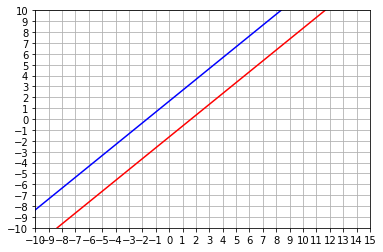
Gaussian Confidence Intervals#
import numpy as np
from scipy.stats import norm
import matplotlib.pyplot as plt
%matplotlib inline

# Resolution
sigma_thetahat = 1.0

confidenceinterval = 0.9

prob_left  = (1.-0.9)/2.
prob_right = (1.-0.9)/2.

theta_min =  -10.0
theta_max =  10.0

theta_obsmin = -5.0
theta_obsmax = 5.0

thetas  = [] # array to collect the scanned theta
lbounds = [] # array to collect the left bounds
rbounds = [] # array to collect the right bounds

nsteps = 100

for i in range(nsteps+1):
    theta = theta_min + i/nsteps*(theta_max-theta_min)
    left_bound  = norm.ppf(prob_left, loc=theta, scale=sigma_thetahat)
    right_bound = norm.ppf(1-prob_right, loc=theta, scale=sigma_thetahat)
    # print (theta, left_bound, right_bound)
    thetas.append(theta)
    lbounds.append(left_bound)
    rbounds.append(right_bound)

plt.plot(lbounds,thetas, 'b-')
plt.plot(rbounds,thetas, 'r-')
plt.axis([-10,15,-8,8])
plt.xticks(np.arange(-10,16, 1.0))
plt.yticks(np.arange(-10,11, 1.0))


plt.grid()
plt.show()
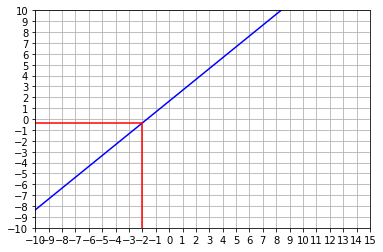
Upper limit at 95%#
import numpy as np
from scipy.stats import norm
import matplotlib.pyplot as plt
%matplotlib inline

# Resolution
sigma_thetahat = 1.0

confidenceinterval = 0.95

prob_left  = 1 - confidenceinterval

theta_min =  -10.0
theta_max =  10.0

theta_obsmin = -5.0
theta_obsmax = 5.0

thetas  = [] # array to collect the scanned theta
lbounds = [] # array to collect the left bounds

nsteps = 100

for i in range(nsteps+1):
    theta = theta_min + i/nsteps*(theta_max-theta_min)
    left_bound  = norm.ppf(prob_left, loc=theta, scale=sigma_thetahat)
    # print (theta, left_bound, right_bound)
    thetas.append(theta)
    lbounds.append(left_bound)

plt.plot(lbounds,thetas, 'b-')
plt.axis([-10,15,-8,8])
plt.xticks(np.arange(-10,16, 1.0))
plt.yticks(np.arange(-10,11, 1.0))


# Read vertically
theta_obs = -2
r = theta_obs - sigma_thetahat * norm.ppf(prob_left, loc=0, scale=sigma_thetahat)
x1 = np.array([theta_obs, theta_obs])
y1 = np.array([-10, r])
x2 = np.array([-10,theta_obs])
y2 = np.array([r,r])
plt.plot(x1, y1, color='r' )
plt.plot(x2, y2, color='r' )

plt.grid()
plt.show()